
The project for the improvement of non-building flood risk management measures in the Republic of Croatia – VEPAR has set the goal of achieving additional value by improving the technical monitoring and maintenance of regulatory and protective water structures (RIZVG).
An integral part of the VEPAR project is the creation of a “smart embankment” pilot project with the aim of creating guidelines for advanced safety monitoring on existing and new river embankments in real time.
In accordance with the project task, the following tasks were performed:
- SELECT LOCATION
The following criteria were taken into account for the selection of the micro location:
- High embankment, the height of the embankment is at least 5 m or more
- Near the settlement
- History of events during flood defences
- Result of preliminary categorization
- Data on materials in the embankment and method of installation and data on the underlying soil
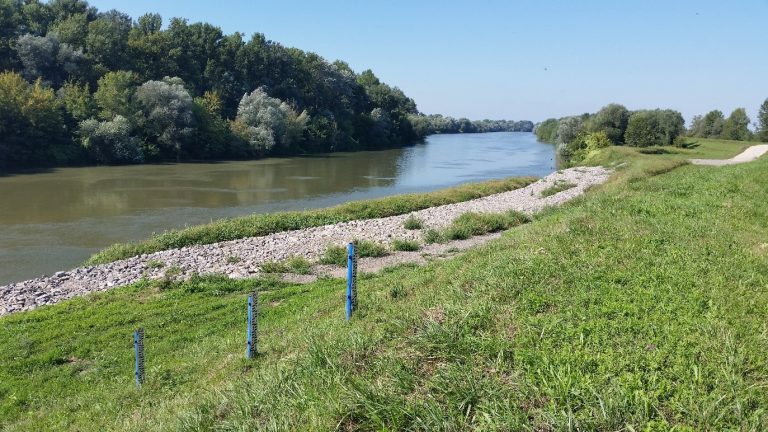
LOCATION OF THE ISLAND
- COLLECTION, PROCESSING, SYSTEMATIZATION, AND ANALYSIS OF EXISTING DATA, INCLUDING THE PREPARATION OF GEODETIC BASE MAPS
The program of field and laboratory investigation works is tailored to previously conducted investigations, site characteristics, the size and function of the structure, and the requirements specified in the project brief.
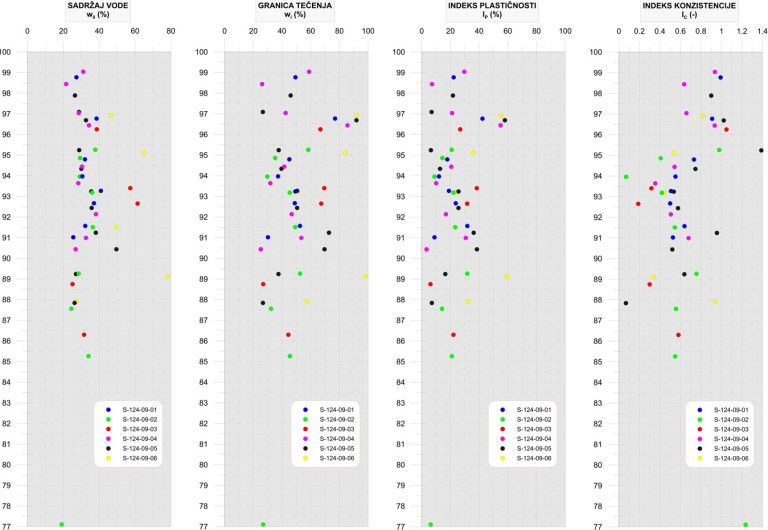
Processing of investigation data
- DEVELOPMENT OF A NUMERICAL MODEL OF THE EMBANKMENT AND FOUNDATION SOIL
The SLOPE/W software—a module of the GEOSTUDIO 2020 suite—was used to create the mathematical model. This model was established based on a numerical representation of expected scenarios where data from sensors embedded in the embankment could be applied. A Monte Carlo probabilistic algorithm was utilized for the mathematical modeling. A series of separate numerical simulations was conducted to generate sensitivity curves regarding identified stability failure mechanisms. Sensitivity curves were then developed for each calculation scenario based on the results obtained from these numerical simulations. 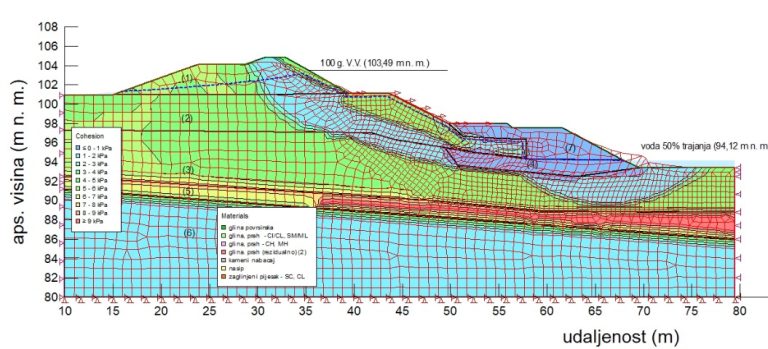
Mathematical model
- INSTALLATION OF MONITORING EQUIPMENT IN THE EXISTING EMBANKMENT AND FOUNDATION SOIL, ALONG WITH GEOTECHNICAL INVESTIGATION WORKS
For the purposes of this project, the following monitoring equipment was installed:
- Sensors for measuring embankment material temperature
- Sensors for monitoring groundwater levels
- Sensors for monitoring and measuring water pressure within the embankment
- Sensors for monitoring embankment displacement caused by vertical vehicle loads and horizontal loads from high water levels
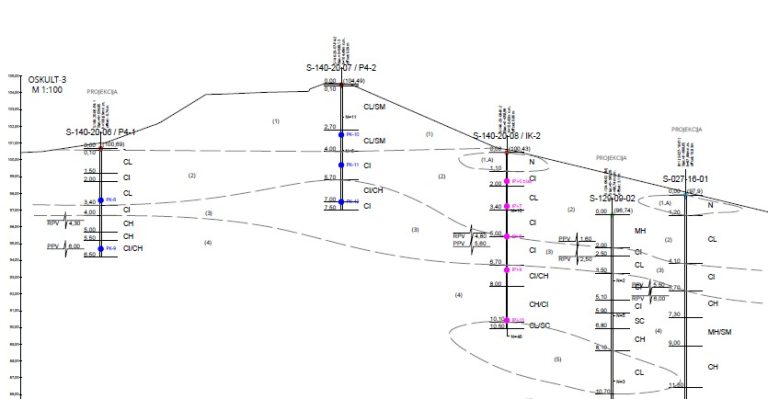
Positions of installed equipment on the profile
- DATA TRANSMISSION SYSTEM CONNECTION
The system architecture consists of a field data logger that transmits data to a server, where the data is stored in a Postgres database.
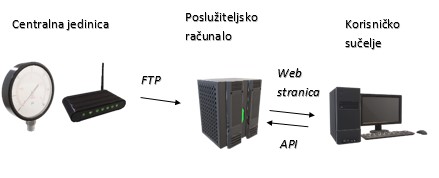
System schematic
- DEVELOPMENT OF A THREE-DIMENSIONAL (3D) GEOGRAPHIC INFORMATION SYSTEM (GIS)
A GIS viewer enables the online display of all measured data in real time.
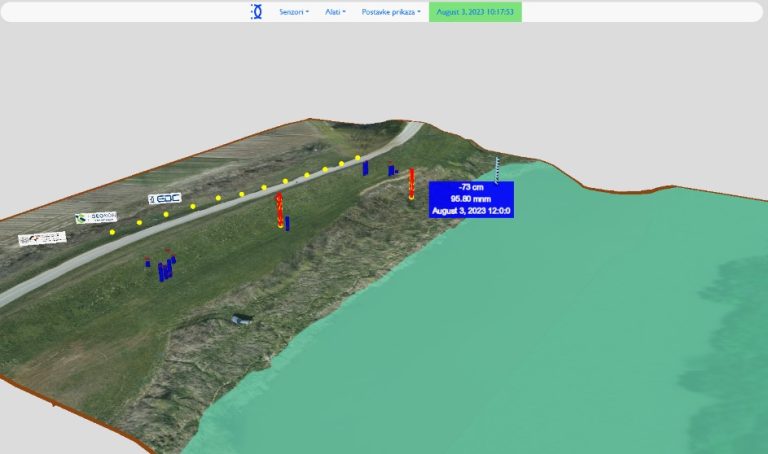
GIS viewer display
- EXECUTION AND EVALUATION OF GEOTECHNICAL MEASUREMENTS
The alarm system is designed so that values measured by instruments within the embankment are instantly transmitted to a web server, which compares them against threshold values defined through analyses of various design scenarios. The user analyzes the data and decides on the appropriate course of action.
The alarm system monitors results derived from mathematical models based on analyses performed using computational models. These mathematical analysis results are presented in sensitivity tables. For anticipated scenarios where embankment damage might occur but for which computational or mathematical modeling is not feasible, critical values are established based on engineering assessment. Measurement data from instruments installed in the “smart embankment” section are transmitted to the web server immediately after the readings are taken. These values are compared against pre-defined thresholds, and any alarm-triggering values are immediately displayed upon accessing the website. In addition to alarms, all instrument readings recorded since the “Smart Embankment” system was activated can be viewed on a computer or mobile device by accessing the server’s website.
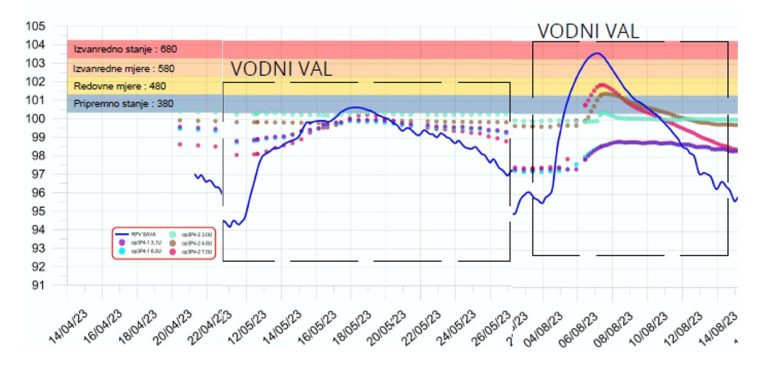
Display of hydrostatic pressure values recorded by an electronic piezometer at the monitoring profile during a flood wave, alongside the water level of the Sava River